Have you ever been in the middle of an important customer analysis and run into that dreaded IT scenario: “Sorry, we can’t combine this data because it’s modeled differently”? It’s hard to be data-driven as a business when you’re constantly encountering situations where you have the data, but your hands are tied from an analytics perspective. Often, the problem happens because you can’t combine your streaming data-in-motion with your historical data-at-rest.
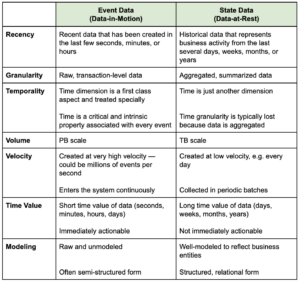
There’s been an explosion in the amount of event data businesses are collecting — fueled by increased digitization, pervasive instrumentation of online experiences, and growth in the number of connected devices. Event data, AKA “data-in-motion,” is raw and transaction-level. It is streaming in at high volumes, making it extremely hard to integrate into traditional analytical systems. So, your business may only be able to use it for specific, siloed use cases, like analyzing the performance of your website or software applications.
However, the true power of event data is when it’s combined with state data — and you can use all your data to understand your product and users, regardless of how different kinds of data are represented. The convergence of data-in-motion and data-at-rest unlocks event stream analytics: a new kind of analytics that empowers your business to make tactical decisions in real-time or near-real-time.
What is event data and how is it different from state data?
Event data captures the sequence of events behind every business process. Consider a simplified example of user interactions on an eCommerce website. Users log in, search and/or browse for products, add products to a shopping cart, checkout, or abandon the site.
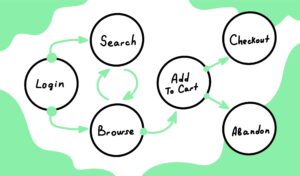
Every user interaction is a recorded event, with a timestamp and associated metadata. Events are chained: each event can have a preceding event and/or a following event. A particular user’s interaction session can be described in terms of an event flow showing the path the user took along the possible set of events and their transitions.
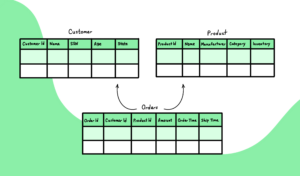
Along the way, events cause changes to states of business entities. There are intermediate states, typically transient, such as the state of a shopping cart during a user’s shopping session. When a state persists long-term — such as an order placed by a customer — it’s typically stored by the business as data-at-rest. This state data is usually represented as relational tables, and often aggregated to create a higher-level view. For instance, an Orders fact table may store aggregated orders data for each day. The example below shows state data for Orders, Customers, and Products.
Here’s a chart summarizing the key differences between event data and state data:
When event data and state data analytics converge
On its own, event data analytics is extremely powerful and can provide many insights into human or machine behavior. With event flow analytics, it’s possible to understand patterns in everything from user journeys to business process flows. Data-in-motion can also be monitored continuously for quick action on anomalies and opportunities. It’s important to note that event data analytics requires expressibility that goes beyond SQL, as well as compute engines specially tailored for efficient sequence operations.
However, the real power comes from bringing in richer context from state data to enhance event analytics.
State data analytics (reporting on historical data) is typically more strategic than operational. But imagine having strategic insights at your fingertips when you have a tactical or operational opportunity to immediately impact a customer experience or business process.
Example
Consider the hypothetical eCommerce business from earlier. An example of event data analysis is: Show me checkout and abandon rates for users who did search and browse actions 4 times in a row within 3 minutes of login. In this scenario, an analyst may be trying to understand the effectiveness of product search on the site.
Now, what if the analyst wants to understand the effectiveness of search across other business dimensions and metrics? For example: Show me checkout and abandon rates for users who did search and browse actions 4 times in a row within 3 minutes of login, broken up by product category and customer segment, limiting to top 5 regions by spend. Note that “product category”, “customer segment,” “region,” and “spend” are state data that is not available in the event stream. In enterprises, such business context tends to be in multiple systems: data warehouses, data lakes, operational data stores, SaaS services such as Salesforce or Zendesk, third-party data feeds, etc. The ability to combine, model, and calculate data across event streams and static state stores is a difficult but key capability for effective analytics.
More complete data-driven decisions
The convergence of event and state data analytics unlocks powerful opportunities to improve business outcomes. Historically, these two worlds have always been siloed, resulting in suboptimal analytics and lost opportunities. Now, modern operational intelligence platforms are emerging that make this convergence a reality, ushering in a new era of event data analytics.
With all your data at your fingertips — regardless of where it comes from or how it’s modeled in code — you can make better data-driven decisions. You’ll be free to explore new analytical questions and unlock insights by combining what you know about your customers’ actions in real-time with what you know about their historical behavior. These insights can even be used to automatically power new kinds of products — for instance, this is how businesses like Amazon or Uber set prices and handle logistics.
To learn more about NetSpring’s next-generation platform, click here, or contact us to get a live demo.
Recommended Reading


