(This article was first published on the Snowflake Blog: Inside the Data Cloud)
Event data for tracking a user’s journey has always been important to product analytics—but we’re now seeing changes in how businesses work with and manage their data, including event data.
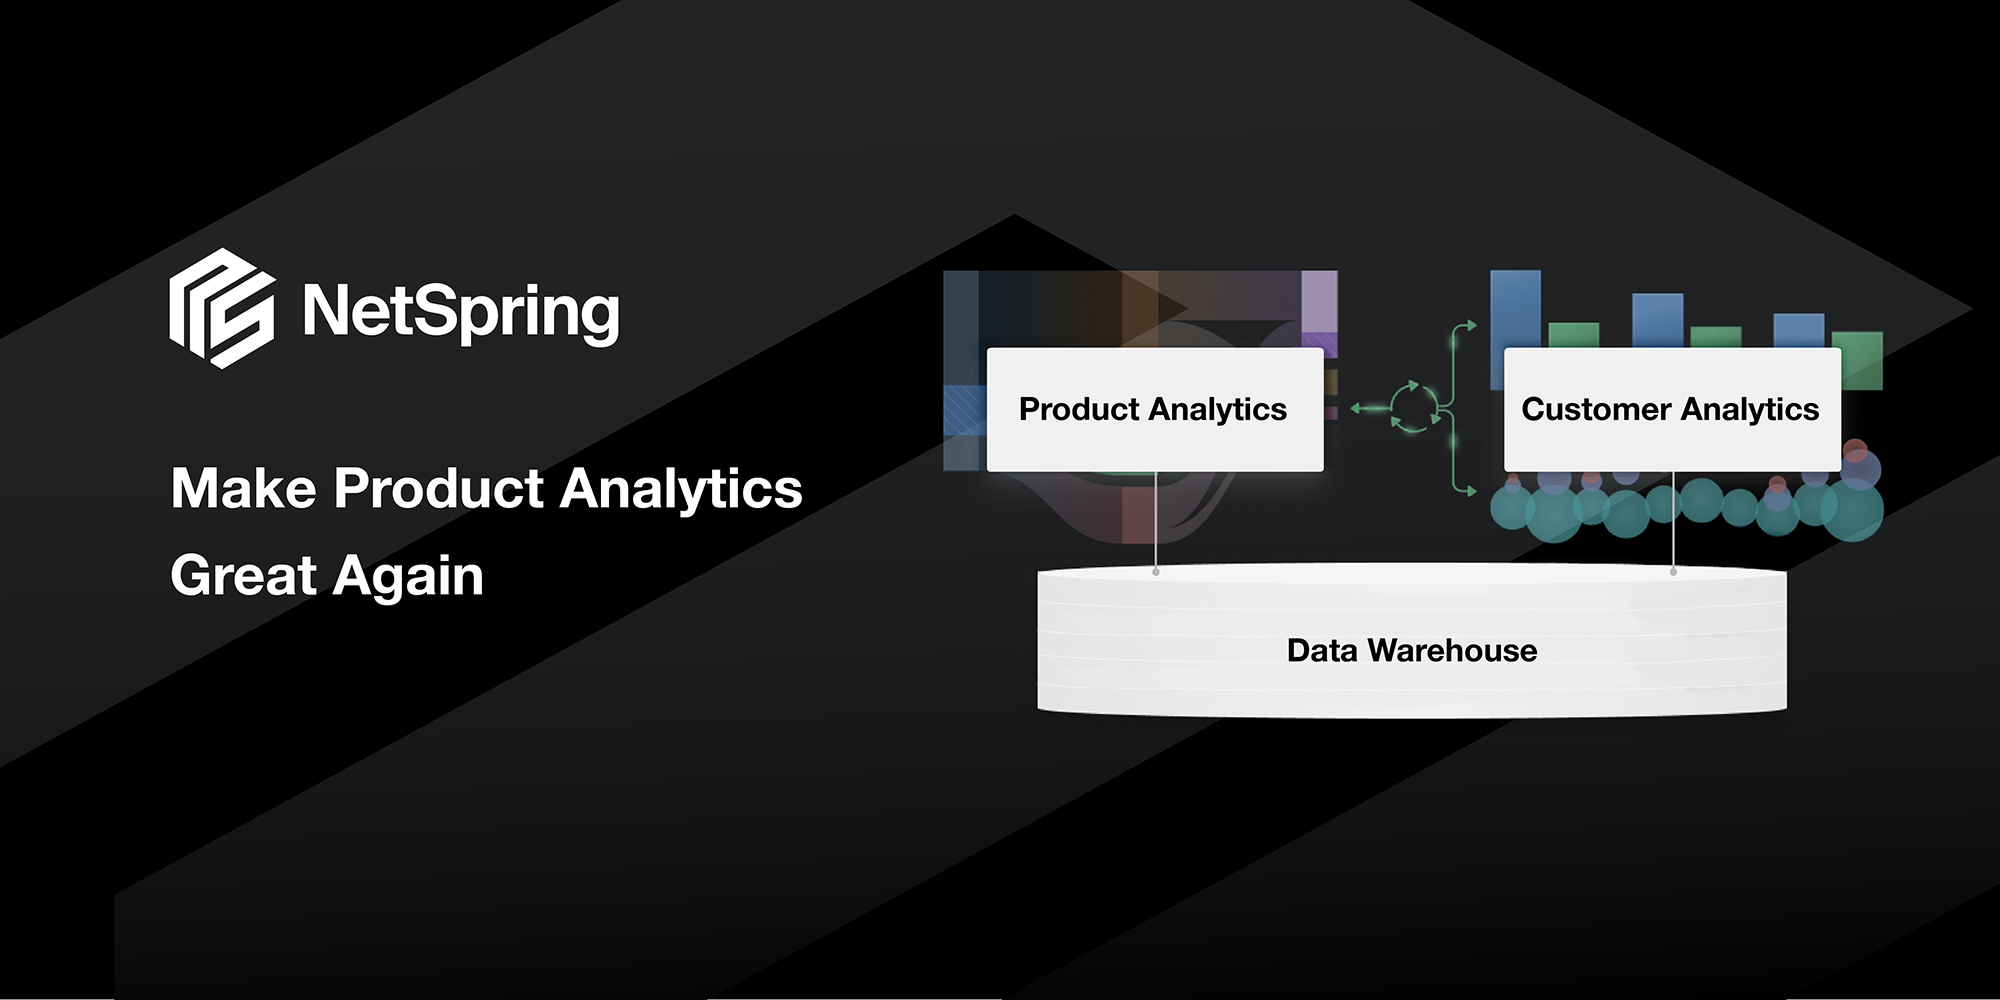
This movement has largely been driven by the disruptive impact of the cloud. The resulting changes to business models and basic technologies spawned next-generation capabilities for practically every category of software, including product analytics. Next-gen product analytics is now warehouse-native, an architectural approach that allows for the separation of code and data. In this model, providers of next-gen product analytics maintain code for the analytical application as a connected app, while customers manage the data in their own cloud data platform.
First-generation product analytics
In 2009, Mixpanel introduced critical capabilities to map granular events to the ways a user might interact with an app—over the web or on mobile. Mixpanel would radically improve the way marketing, product, and development teams could identify engagement drivers and grow their products. Every decision could be justified with data.
First-generation tools have integrated product instrumentation libraries that collect and hold data in black box stores within their closed analytic platforms. Because they capture only digital product events and are disconnected from the vast majority of enterprise data, they are only working with a very small subset of customer data. At best, they can bring in a limited set of properties from an enterprise data warehouse using reverse ETL tools.
Product analytics today
Based on its conversations with customers and prospects, NetSpring estimates that 80% of enterprises are forced to duplicate and export product instrumentation data to a data warehouse and enrich it with other business data in order to:
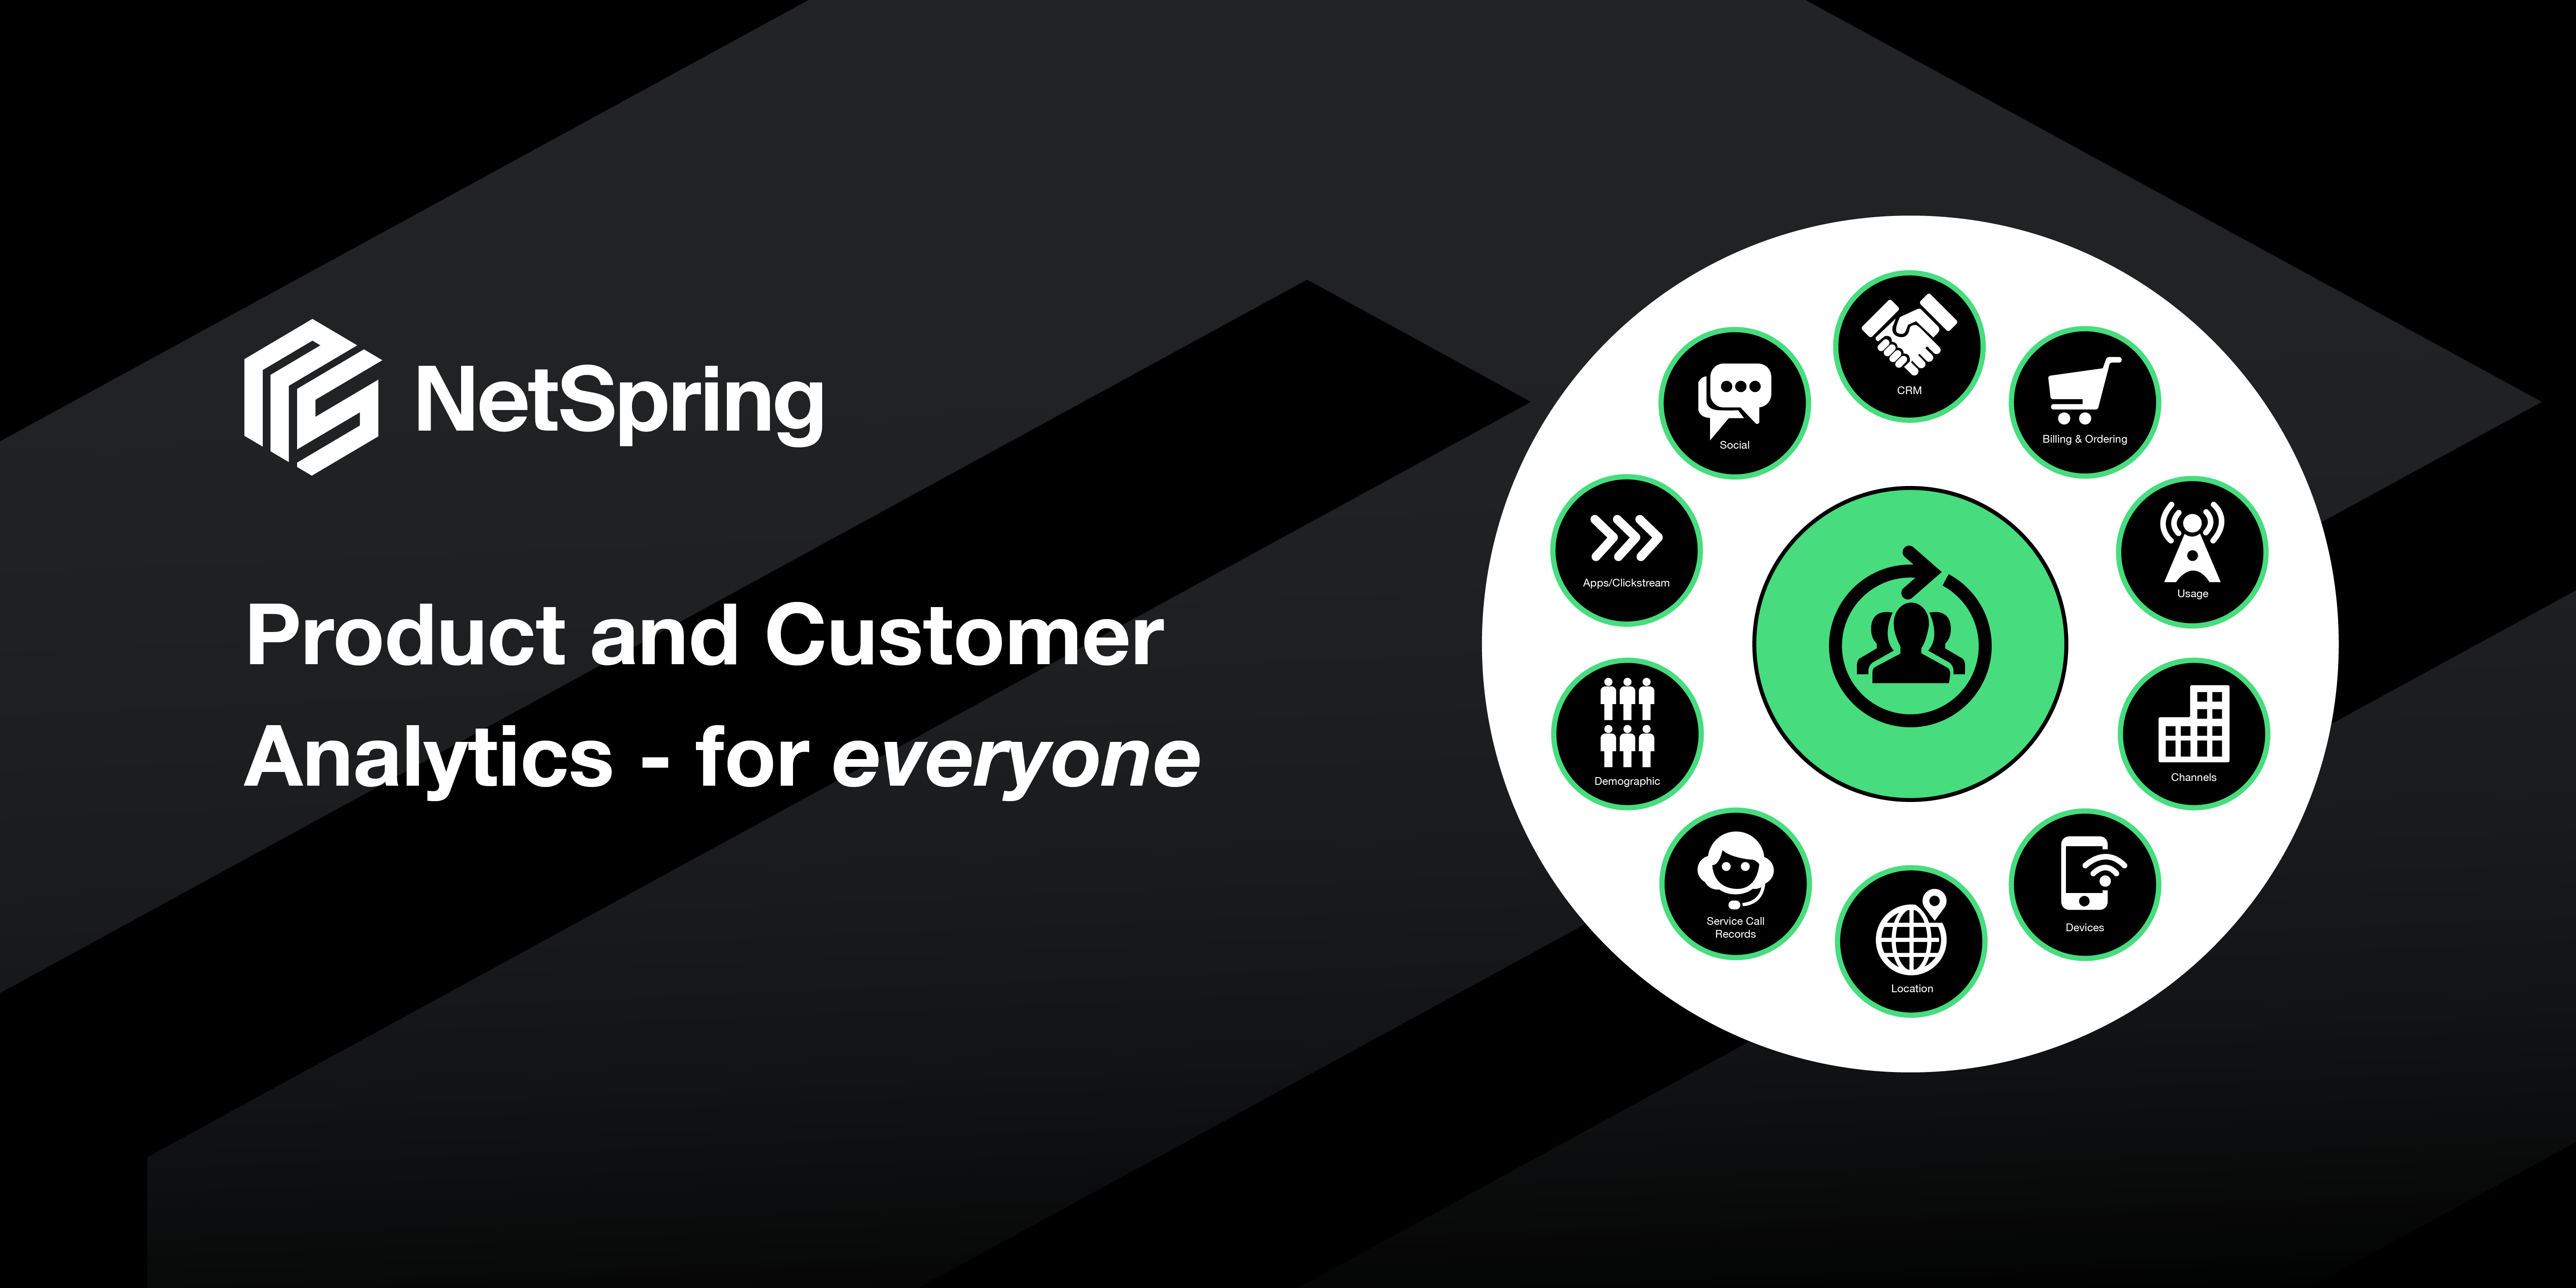
- Get a complete view of customer and account-level journeys
- Understand attribution
- Derive cross-functional business insights that will interest executives and other stakeholders
In addition to numerous data management issues, this approach creates a heavy dependence on data and analytics teams to provide custom SQL and BI reports. However, BI tools were not designed for time series and event data analysis, resulting in a mismatch with typical product analytics visualizations like funnels and paths. Moreover, context is lost when moving from the richer data models in the warehouse-native approach back to first-generation tools. And not surprisingly, custom SQL on funnel and path-type queries can take hours to write and test, with resulting custom reports taking two or more weeks to turn around. That impedes the natural curiosity of product teams and growth marketers looking to unlock insights at the speed of thought.
The first generation of product analytics tooling was primarily about tracking and managing front-end events. As such, these tools often need to be further supplemented by broader capture solutions to bring in back-end instrumentation via solutions such as Segment, Rudderstack, or Snowplow. Regardless, tracking remains the most significant in terms of implementation effort and associated business value. While first-generation tools do offer analytics capabilities, their pre-canned reports often fall short, and users continually lament the lack of BI-style capabilities they are accustomed to from tools like Tableau.
The opportunity
First-generation product analytics tools were introduced over a decade ago, and during that time there’s been another major technological development: the modern data stack. The fundamental principle of the modern data stack is that all data goes to a centralized, cloud-based location like Snowflake. A common central store offers advantages in terms of consistency, security, governance, and manageability. Most important, as the single source of truth for all data, it can help avoid or completely eliminate data duplication and expensive ETL pipelines.
In the modern data stack, analytics tools and capabilities such as BI and AI/ML already sit directly on the data platform. So why shouldn’t product analytics work the same way?
In other words, product analytics should also be native to the customer’s data platform, and delivered as a single connected app offering best-in-class analytical capabilities. The problem is that product analytics workloads are extremely complex, and require the ability to query event streams and relational data simultaneously. It’s hard enough to make these workloads performant, let alone self-service.
NetSpring: The connected app for data platform-native product analytics
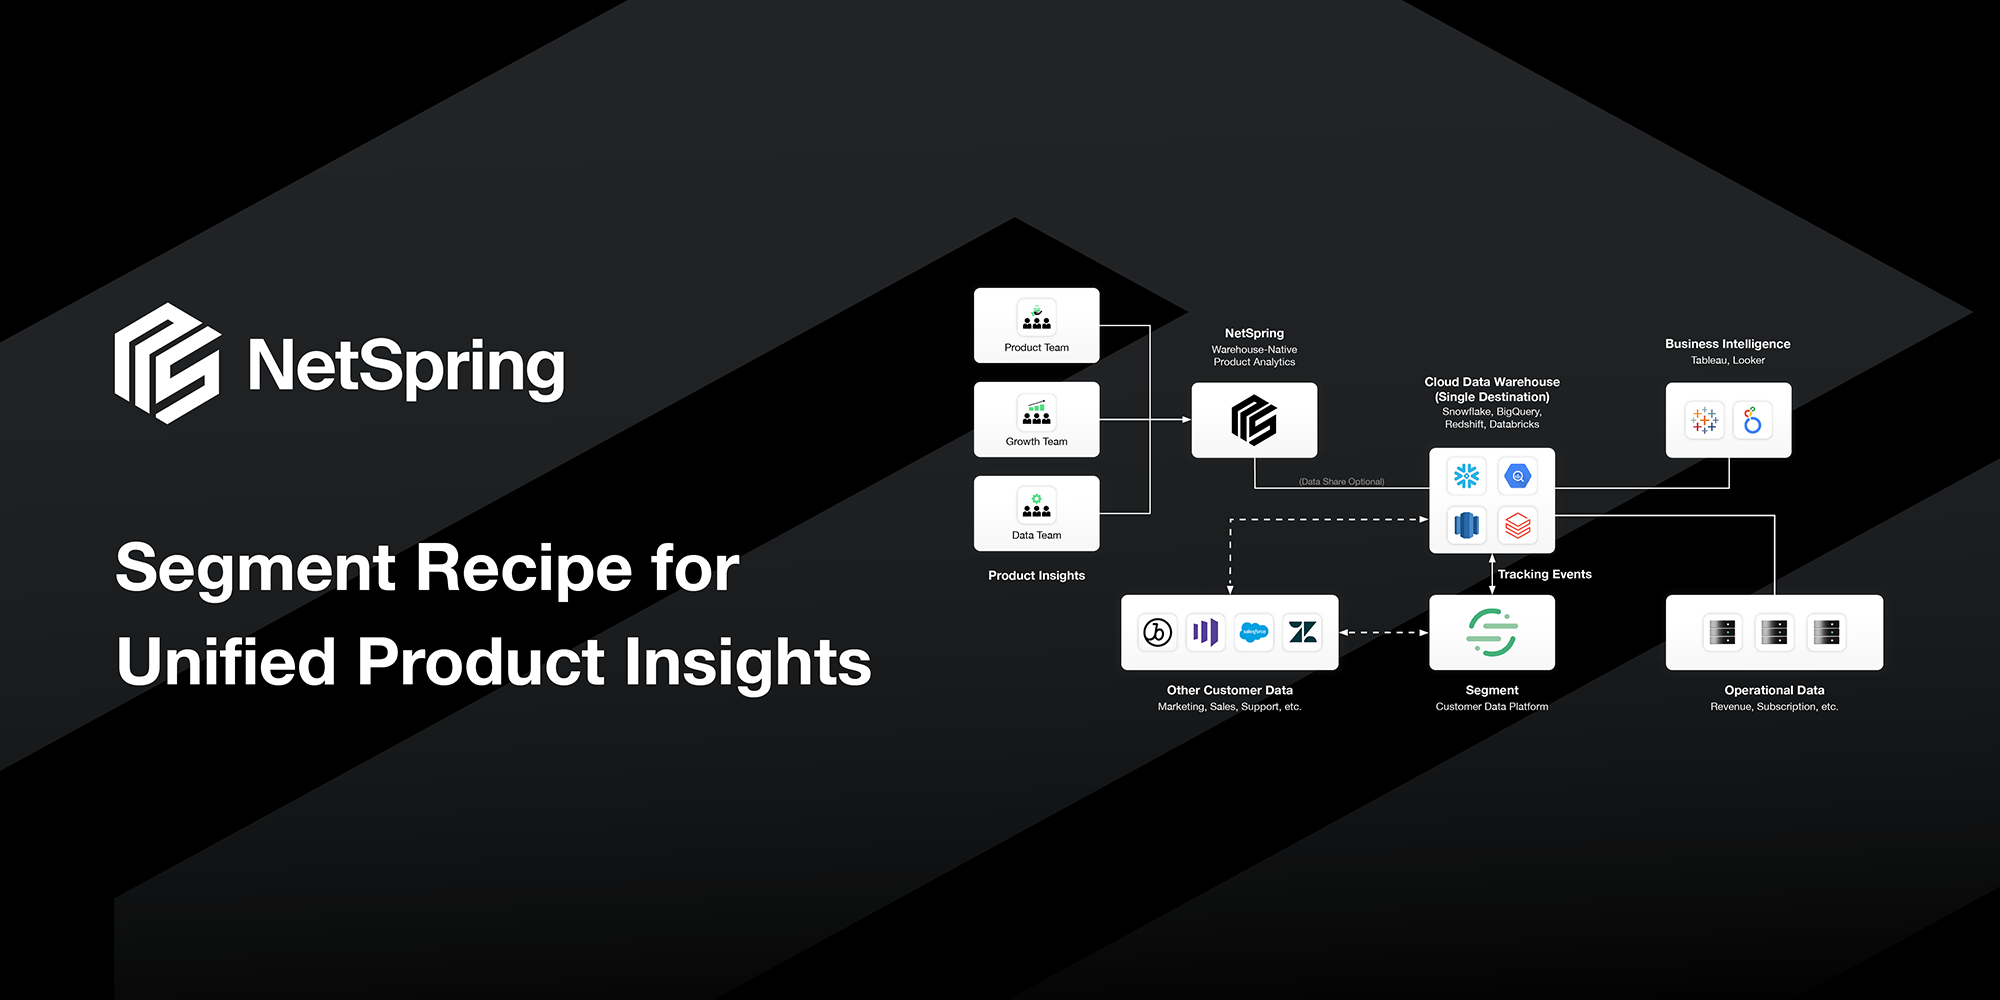
NetSpring is taking on these challenges with a connected app for next-gen product and behavioral analytics that runs natively on top of Snowflake as a self-service analytics platform. NetSpring separates application code from instrumentation and other business data, which customers manage themselves in their own Snowflake instance.
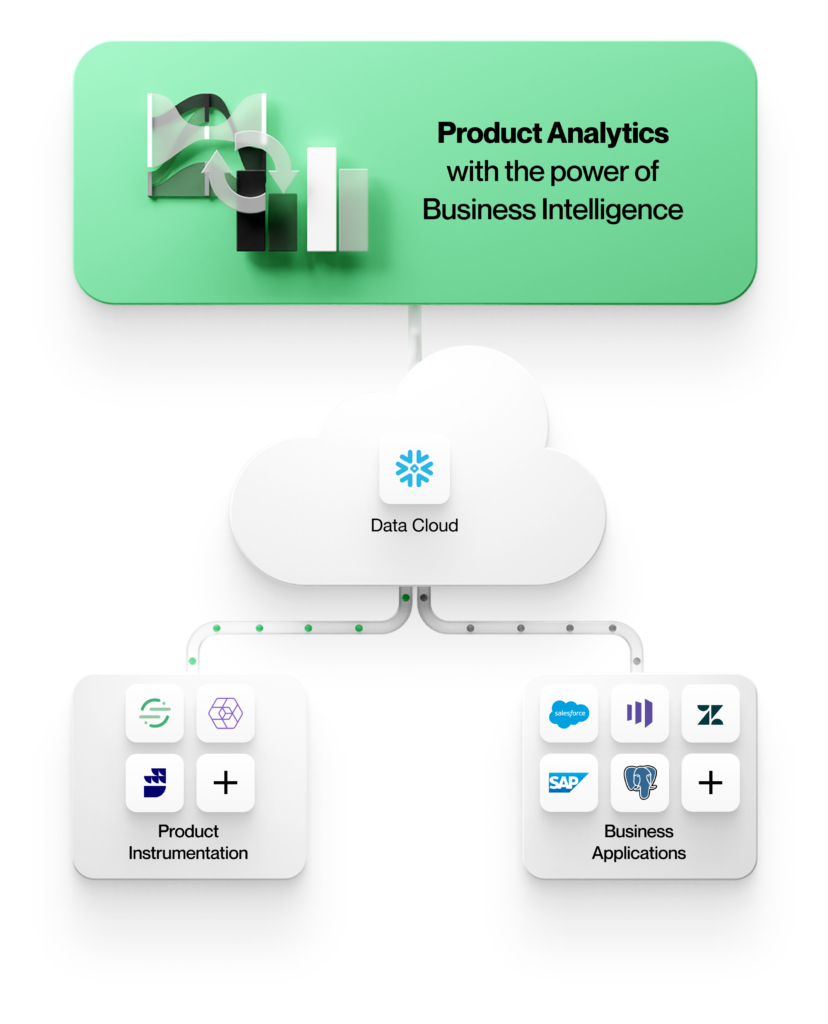
As a connected application, NetSpring directly queries against all event and reference data in Snowflake, while bringing the analytical power of BI to self-service product analytics. This allows you to:
- Get self-serve answers to any question by starting from a rich library of reporting templates, with the ability to pivot seamlessly back and forth between any report and ad hoc visual data exploration.
- Avoid writing and maintaining complex SQL for funnel/path-type queries, but have the option of leveraging SQL for specialized analysis.
- Combine product instrumentation with any business data in your data platform for context-rich analytics.
It’s time to focus on the “analytics”
Where first-generation tooling focused on the “product” in product analytics, next-generation solutions focus on the “analytics.” They start with a cloud- and platform-native approach and use the connected app model to deliver best-in-class product and behavioral analytics capabilities. NetSpring leverages the strength of a connected app to offer advanced behavioral profiling with event stream analytics, while leveraging the flexible modeling and analytical capabilities of BI, directly on Snowflake.
Rather than simply reporting on product metrics, business users can now deeply understand the cross-channel behavioral patterns that drive adoption, engagement, and key business metrics such as account-level revenue and retention. Getting started is easy. Simply connect to Snowflake, and be up and running in under an hour. To learn more, please visit netspring.io and request a demo today.


