SKIP TO CONTENT
NetSpring has been acquired by Optimizely → Read the release

Product & Customer Analytics

Warehouse-native with the exploratory power of BI
QueryDirect

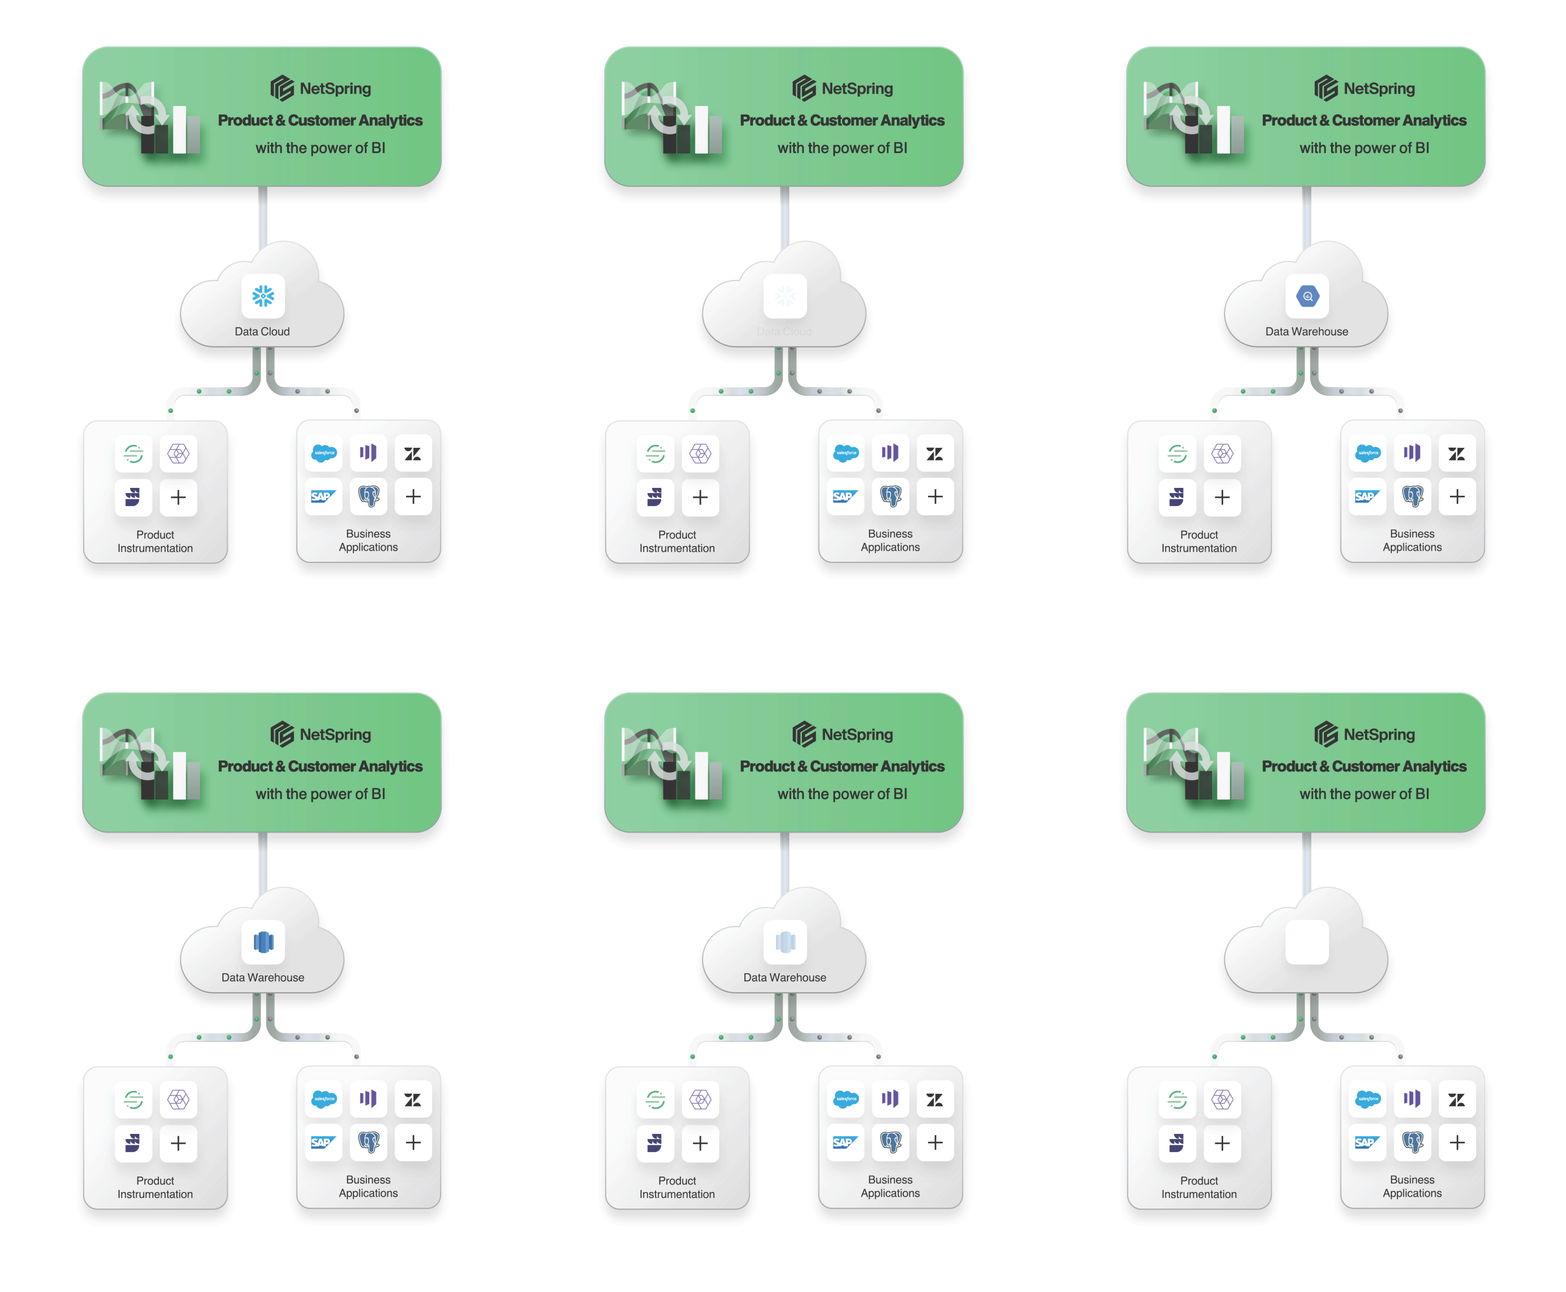
Connect your cloud data warehouse, and NetSpring directly queries against all your event and reference data – with no data duplication.

All popular cloud data warehouses are supported, including Snowflake, Google BigQuery, Amazon Redshift, Databricks, and Azure Synapse.

If your data warehouse isn’t on this list, please contact us.

Workbench

Flexibly model across all tables in the data warehouse to capture cross-channel behavior.

Easily establish relationships between event streams and business data models to enrich events. Dynamically compute shared product and business-level metrics.

Richly define behavioral patterns of any object by sequences and durations. Model hierarchical relationships between objects (e.g an account’s users and projects).

Blocks

Get last-mile customizability without having to resort to raw SQL, all from a UI-driven interface.

Combine any number of blocks to express analytic computations of arbitrary complexity.

Define and publish user-defined blocks that model your unique business logic.

Advanced Behavioral Profiling

Build a complete time-oriented behavioral graph for any object, spanning events from any source, conditional events, and associated objects.

Define stages as conditional sequences of events across streams and business systems. Then compose multi-level funnels with sub-journeys for any associated object or property.

Easily create dynamic segments of any object based on behavioral patterns.

Templates

Start from a rich library of report templates for event segmentation, retention, funnels, paths, etc.

Perform self-guided ad hoc analysis with visual exploration.

Use the full power of SQL and NetScript templates for specialized analysis.

Beeline

Get answers to your next question by pivoting iteratively between any report or ad hoc visual data exploration.

Analyze behavioral patterns by slicing-and-dicing across any dimension. Compare reports to refine visualizations and insights.

Preserve and propagate context throughout your ad hoc explorations.

Live View

Track product and business-level metrics from adoption and engagement, to attribution and revenue.

Quickly understand usage and revenue from interactive dashboards.

Access a rich library of highly-configurable visualizations and layouts. Filter by any static or dynamic property, flow, or collection of objects.

Monitor

Maintain continuous visibility and actionability into key metrics and behavioral cohorts.

Configure alerts and workflows with noise reduction controls.

Get notified of anomalies and stay continuously connected to key product and business metrics.

Architecture

Product and Customer Analytics
in the Modern Data Stack

Best-in-class analytics and instrumentation, centered on the data warehouse. Leveraging the Composable CDP.

Learn More

Getting set up is easy.

Connect to Snowflake, BigQuery, Redshift or Databricks. Be up and running in hours.

Get Started